What is Tableau?
Anything you see around is developed using technology. Most technologies are used to narrow down the larger data sets for customers to find out what they need in the shortest possible time and at the lowest cost. It requires processing and visualizing extensive data to get insights into what is required by customers. For example, if a customer is looking to book a flight, an app developed should take inputs from the customer and narrow down the large data set available on the airline server to provide the required info to the customer for booking. The customers are least interested in how they receive that data; all they want is the requested data in tabular or graphical form.
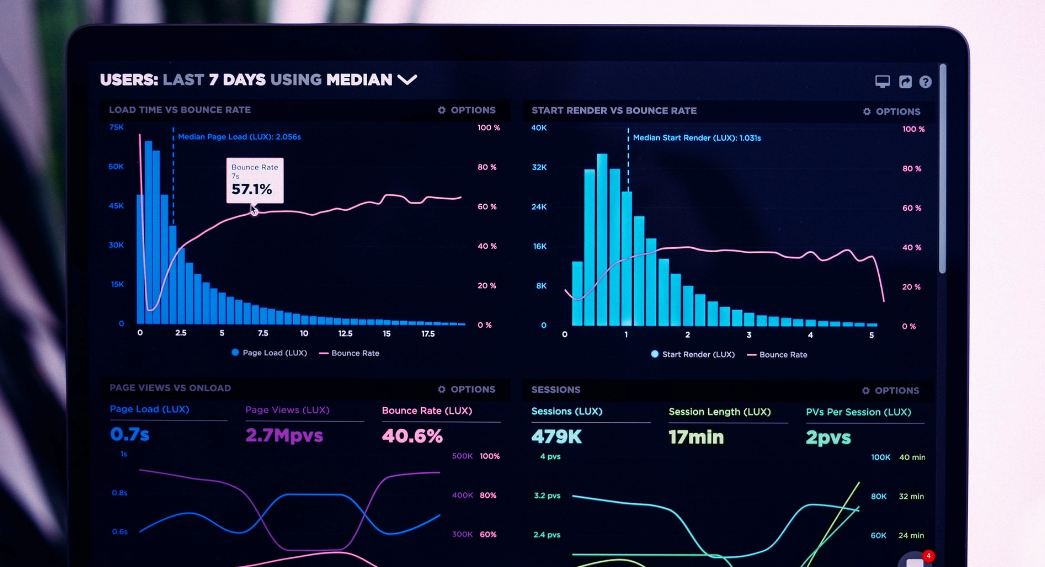
Visualization is a process with which large data sets can be narrowed down and represented in easy-to-understand forms such as tables, plots, graphs, and so on. It is established that any information can be expressed more easily through visualized data compared to raw form. Effective visualization helps your business achieve unexpected heights. On the contrary, if visualization is poor, it can affect your customer base negatively. Companies are now well aware of the importance of visualization and are looking for expert data analysts to create quality visualizations for their businesses for quick decision-making. Data analytics is a booming field, particularly for professionals with quality visualization skills. As more and more companies hire data analytics experts, this role is always in high demand and provides exceptional job security and earning potential.
Why Tableau?
Data analytics experts require a tool that is – fast, user-friendly, powerful, malleable, and so on. Among many tools available for analytics and visualization, one has to select a tool that possesses all required features. Tableau is one such tool having all the features that an analytics expert desires for rapid and comfortable data visualization. It is developed with features needed to process, analyze and visualize the raw data in the form of plots, charts, graphs, or various other types of visualizations. Colorful charts, plots, and tables are considered one of the best visualization elements to attract and help to identify hidden trends, patterns in the raw data. Tableau encompasses numerous charts, graphs, and table options which one requires to create attractive and helpful dashboards. It allows one to create both static and dynamic reports based on their needs and is an effective way to communicate outcomes.
Even with the presence of many visualization tools present nowadays, Tableau has maintained its position very strongly and is attracting more and more people’s eyes. Clients prefer Tableau due to its success in providing a great response, effective outcomes, and user-friendly interface. The tool is also popular among data professionals, and they often take the Tableau eLearning program to become well-versed in it.
Pros of Tableau
Tableau has been rated as the best visualization tool for seven consecutive years, according to Gartner’s Magic Quadrant for BI and Analytics. This is a clear indication that Tableau stands out among the variety of data visualization solutions in the market. Available in the market for over 15+ years has helped Tableau develop features to design awesome visualizations in a matter of time, even if ones are new to analytics. The list of features available in Tableau certainly exceeds the user’s expectations.
Here are some of the popularised qualities of Tableau.
Astonishing Visualization Capabilities
Absolutely, the extraordinary visualization capabilities of the Tableau application are on the top of the list. Tableau’s data visualization capabilities are superior to other application providers in the data analytics field. One can use this application to convert unstructured data into attractive visualizations such as appealing plots, charts, and design interactive dashboards.
User Friendly
Tableau is designed with the primary focus to provide a user-friendly interface that is easier for new users or users with little experience in the analytics space. A user-friendly interface along with the adorable graphic designing capabilities of Tableau enables even freshers to master the tool easily and develop interactive dashboards. The drop and drag feature is particularly helpful to let users arrange the graphs obtained from raw data into a layout to build a story for the customer. Simple dashboards do not require any training or IT expert help; however in the case of complex solutions IT help is recommended along with proper training.
Growing Community and Customer Support
While working on any tools, it is important to get the right support at the right times. Since Tableau has a large active user base and an ever-growing community, support for resolving queries or issues is easily available. New users can learn from various Tableau experts in communities and gain skills to prepare appealing dashboards. Apart from strong community support, the Tableau customer support team is highly appreciated and receives excellent reviews.
Data Source Connections
Tableau easily integrates with many data sources such as Hadoop, SAP, and others. It is very important since data in any organization may come from various sources and require integration. Overall, allowing connections to multiple data sources improves visualization and helps create interactive dashboards. Tableau supports Google BigQuery API, beneficial for many organizations as it can be helpful in highly detailed analytics. Tableau provides an extensive roster of native data connections allowing easy integration with data from many sources.
Exceptional Performance
Along with all the features and benefits, Tableau tends to provide you with high-end performance creating it an ideal tool. It works efficiently and effectively with heavy data, Tableau can handle millions of rows of data with ease. Various visualizations can be created with a very large amount of data without impacting the performance of the dashboards. One can trust Tableau for its high speed and qualitative outcome without much processing time.
Platform Independence
The application supports Android and iOS. Mobility helps users by giving flexibility and allowance to work anywhere and anytime. The Mobile Versions of Tableau also support all the latest features, which give you relief from sitting in a room and working.
Cons of Tableau
Cost
Tableau requires subscriptions or licenses which may not be too costly for big companies, however for small or middle-level organizations subscription costs may be a bottleneck.
Expertise for Advanced Analytics
Even if the App provides an easy interface, assistance from an IT expert is advised for further functionality and business outcomes. Some of the processes need the use of SQLs, which is impossible without the help of an IT professional.
Poor Versioning
Only the latest version of Tableau supports version rewinds. The rest of the versions won’t let you jump to a previous version like other tools in the competition, which also is a major disadvantage.
Time-and-Resources intensive training
Tableau consists of an ability to provide an excellent result without any major prior knowledge but to know all the functions and features of the tool would be impossible without any Official Study. The training can take several months, but after the intense training, you will be an expert in the Tool’s Management.
![[pii_email_4f1c0cd5ced5cf34f2ed]](https://redditworldnews.com/wp-content/uploads/2021/05/pii_email_4f1c0cd5ced5cf34f2ed.png)
![[pii_pn_62bfc46a86f6d36a7569]](https://redditworldnews.com/wp-content/uploads/2021/05/pii_pn_62bfc46a86f6d36a7569.png)